Monday, May 26, 2008

Assignment # 6

Assignment #6

Question #1


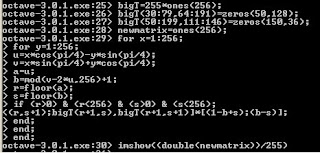
The line above the 3-end; should read
> newmatrix(x,y)=[(1-a+r),(a-r)]*[bigT(r,s),bigT(r,s+1);bigT(r+1,s),bigT(r+1,s+1)]*[(1-b+s);(b-s)];


Question #2


Question #3a

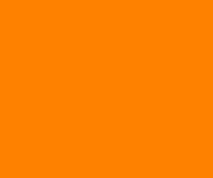
Original Colour Displayed


Average Colour Displayed
red= 255, green=129, blue=0


Question #3b
Facebook Original Colour Displayed

Facebook Average Colour Displayed
red= 145, green=88, blue=77
Facebook Octave Commands

My Original Colour Displayed

My Average Colour Displayed
red=137, green=135, blue=136

My Octave Commands:

Question #3c-Row 4, Column 2

Original picture displayed


Average Colour Displayed
red=64, green=62, blue=42

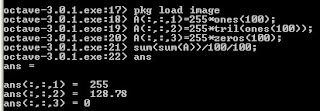
Octave Commands

Question #3c-Row 9, Column 2
Original picture displayed


Average Colour Displayed
red=28, green=152, blue=225

Octave Commands:


Friday, May 23, 2008

Assignment #5

Assignment #5


Question #1

circle=255*zeros(256);
for x=1:256;
for y=1:256;
if (x-128)^2+(y-128)^2<=2500; circle(x,y)=1;
end;
end;
end;


Question #2


Question 3 (TM- Theta=(pi/4), s=2)


Skewing the image by a factor of 2 pixels horizontally:


Rotated by (pi/4):


Skewing by a factor of 2 pixels horizontally and rotating (pi/4)


Sunday, May 18, 2008

Assignment #4

Assignment #4
1. ones(256,1)
2. [0:1:255]
3. [0:1:255]'
4. ones(256,1)*[0:1:255]
5. [0:1:255]'*ones(1,256)
6. zeros(256)
7. ones(256)
8. 128*ones(256)
9. zeros(256)
10. imshow(ones(256,1)*[0:1:255]/255)


11. x(:,:,1)=[ones(256,1)*[0:1:255]/255]';
x(:,:,2)=zeros(256);
x(:,:,3)=[ones(256,1)*[0:1:255]/255];
imshow(x)
RB Face

12. x(:,:,1)=[ones(256,1)*[0:1:255]/255]';
x(:,:,3)=zeros(256);
x(:,:,2)=[ones(256,1)*[0:1:255]/255];
imshow(x)

RG Face

13.x(:,:,1)=zeros(256);
x(:,:,2)=[ones(256,1)*[0:1:255]/255]';
x(:,:,3)=[ones(256,1)*[0:1:255]/255];
imshow(x)

GB Face

14. x(:,:,1)=[ones(256,1)*[0:1:255]/255];
x(:,:,2)=ones(256);
x(:,:,3)=[ones(256,1)*[0:1:255]/255]';
imshow(x)

CY Face


15. x(:,:,1)=[ones(256,1)*[0:1:255]/255]';
x(:,:,2)=[ones(256,1)*[0:1:255]/255];
x(:,:,3)=ones(256);
imshow(x)

CM Face

16.x(:,:,1)=ones(256);
x(:,:,2)=[ones(256,1)*[0:1:255]/255]';
x(:,:,3)=[ones(256,1)*[0:1:255]/255];
imshow(x)

YM Face

17. Spectrum Cube


18. Facebook Spectrum


19. a=[1,1,0,0;1,0,1,0;0,0,1,1]
a=
1 1 0 0
1 0 1 0
0 0 1 1
circshift (a,[0,-1])
1 0 0 1
0 1 0 1
0 1 1 0

20. a=[1,1,0,0;1,0,1,0;0,0,1,1]
circshift (a,1)
0 0 1 1
1 1 0 0
1 0 1 0

21.


22.

Assignment #3 Question #6

Question #6a

The hue(H) is the angle of the vector shown with respect to the red axis. If H=0 then the colour is red. the saturation (S) is the degree which the colour is not diluted by the colour white and it is the distance from the center of the triangle diagram. Intensity is measured according to a the line that is perpendicular to the triangle and passes through the center. The hue would change according to its position with respect to the red axis. The intensity would change with respect to its distance from the black point. The further the distance the greater the intensity. In this scenario, I believe that the hue changes. In other words when the colour/hue changes chances are we will see the new colour. There is little affect on the S and I. (The further away from the center the more saturated the colour becomes and the greater the intensity.) When the hue changes, lets say 60 degrees from the red axis, we see yellow.

The following are the formulas for HSI with respect to RGB.


Question 6b
The following image reflects the exchange of blue with red colour channels. In my version of GIMP I had to use components, then the channel mixer to change the red and blue colours. I had to select the red colour and change set the red percent to zero and set the blue percent to 100. Then I did the opposite for the blue component.

Assignment #3 Question #5

Question #5
This transformation send white to black, a pixel with a lot of blue to a pixel with little blue and a pixel with a lot of red to a pixel with little red. So I hope! Far too tired!

Assignment #3 Question 4

Question #4a
Since the text states "all colours are at maximum intensity and saturation." The components will all range between the values of 0 and 1 for both RGB and CMY.

Through the use of the Octave program, I was able to enter the the components for CMY. The following are the results of how these components would appear on a monochrome monitor. I determined the components by using the formula C = 1-R, M=1-G and Y=1-B.


Question #4b

If the CMY components sketched above were fed into the RGB inputs of a colour monitor, respectively, the results outputs 8 strips with a grey border around them. The strips would start with White, Cyan, Blue, Magenta, Red, Yellow, Green, then Black. Refer to the spreadsheet in part 4a.

Assignment #3 Question #2, 3


(If you cannot see the above solution, just double click on the text to see it better.)

This expression does work. Therefore, this expression can compute the relative percentage of colour that is known to lie on the straight line joining two colours.

Another method: Let C be the given colour and let the coordinates be represented by (X0,Y0). The distance between C and C1 can be calculated using the following:

d(C,C1)=sq. root of [(X0-X1)squared +(Y0-Y1)squared]

You can also use the above to calculate the distance between C1 and C2

d(C1,C2)=sq. root of [(X1-X2)squared +(Y1-Y2)squared]

To find the percentage, let P1 represent the percentage of C1 in C by using the following:

P1=[[d(C1,C2)-d(C,C1)]/d(C1,C2)] *100

Once you find P1 finding P2 of C2 is pretty straight forward. Use P2=100-P1.

Question #3
The following expression can compute the relative percentage of colour that is known to lie within the triangle whose vertices are at the coordinates of C1, C2, and C3. Where C1(x1,y1), C2(x2, y2) and C3(x3, y3).
Consider the following:

a1+a2+a3=1
then,
x=a1x1+a2x2+a3x3
y=a1y1+a2y2+a3y3
Consider the following matrices:
[1,1,1;x1,x2,x3;y1,y2,y3]*[a1;a2;a3]=[1;x;y]
If we use the inverse of the first matix above, we determine the following results:
[a1;a2;a3]=[1,1,1;x1,x2,x3,y1,y2,y3]inverse *[1;x;y]

Assignment #3 Question #1

The colour space looks like a shark fin because the boundary is a representation of the pure colours in the spectrum and as you move within, the spectrum becomes a mixture.

Data


The first graph is a representation between the wavelengths (380-700nm) and the colour red(x) divided by green(y). I'm not sure, but according to my graph, it looks as though, the blue is very evident and is not affected between 380 and 540nm. The colour red(x) has been affected. I'm thinking that the colour red saturates the colour green and therefore the results show a mixture within the red????

The second graph is a representation between the wavelengths (380-700nm) and the colour green(y).


The third graph is a representation between the wavelengths (380-700nm) and the colour blue(z) divided by green(y). The colour green and red are saturated leaving blue only????